Maryland casinos generate $169.4 million in gaming revenue in May
$5,000 Welcome Bonus
BALTIMORE, MD—Maryland’s six casinos combined to generate $169,401,366 in revenue from slot machines and table games during May 2023, a decrease of $9,366,462 (-5.2%) compared to May 2022.
Casino gaming contributions to the state in May 2023 totaled $70,831,586, a decrease of $2,614,929 (-3.6%) compared to May 2022.
Contributions to the Education Trust Fund (ETF) in May 2023 were $51,488,339, a decrease of $1,934,414 (-3.6%) compared to May 2022. Casino gaming revenues also support the communities and jurisdictions where the casinos are located, Maryland’s horse racing industry, and small, minority- and women-owned businesses.
Maryland’s six privately owned casinos offer both slot machines and table games: MGM National Harbor in Prince George’s County; Live! Casino & Hotel in Anne Arundel County; Horseshoe Casino Baltimore in Baltimore City; Ocean Downs Casino in Worcester County; Hollywood Casino Perryville in Cecil County; and Rocky Gap Casino Resort in Allegany County.
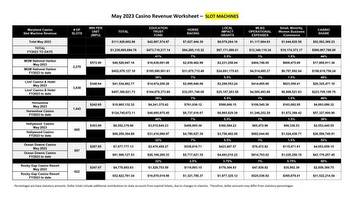
The gaming revenue totals for May 2023 are as follows:
- MGM National Harbor (2,279 slot machines, 210 table games)
$71,716,915 in May 2023, a decrease of $4,247,876 (-5.6%) from May 2022 - Live! Casino & Hotel (3,838 slot machines, 179 table games)
$58,934,594 in May 2023, a decrease of $3,792,290 (-6.0%) from May 2022 - Horseshoe Casino (1,443 slot machines, 122 table games)
$17,516,043 in May 2023, a decrease of $165,293 (-0.9%) from May 2022 - Ocean Downs Casino (857 slot machines, 19 table games)
$8,402,111 in May 2023, a decrease of $106,092 (-1.2%) from May 2022 - Hollywood Casino (695 slot machines, 19 table games)
$7,602,531 in May 2023, a decrease of $610,975 (-7.4%) from May 2022 - Rocky Gap Casino (622 slot machines, 16 table games)
$5,229,172 in May 2023, a decrease of $443,937 (-7.8%) from May 2022
Details on each casino’s gaming revenues and contributions to the State of Maryland are included in the attached charts, and both fiscal and calendar year-to-date totals are available online here (PDF).